Unlocking Earth’s Secrets: Making Earth Observation Data More Accessible
21st Mar 2024
With upwards of 100 terabytes (TB) of Earth Observation (EO) data collected daily by hundreds of different satellites and multiple providers, it can be a headache knowing where to start if you want to access, use or analyse this data.
But what if accessing this data could be as easy as searching the web? That is where Mallon has been working to create a simplified tool that makes it easier than ever to access EO data.
What is Earth Observation Data?
Earth Observation is the collection, analysis and presentation of information about planet Earth’s physical, chemical and biological systems via remote sensing technologies. Typically, this information is collected through satellites that take a continuous series of images as they pass above us.
Currently, Earth Observation Data is used by a host of industries and organisations for different land and environmental monitoring purposes, including agriculture, forestry, water resources, infrastructure, and natural disaster response, to name a few.
Barriers to using Earth Observation data
While a wealth of EO data is available, there remain significant barriers to accessing this information. Complexity is often the principal barrier to new users seeking to access EO data.
At present, anyone possessing EO data must know how to use EO software or a programming language to process the data into more meaningful information. On top of this, access to a robust and powerful computer is required to process large numbers of EO images. These can be highly off–putting to those lacking the necessary technical expertise and can cause new users to abandon their efforts to utilise the wealth of available EO resources.
Mallon’s Solution
We are continually trying to help new users take advantage of Earth Observation, and with the creation of our new tool, we aim to make EO data more accessible than ever before.
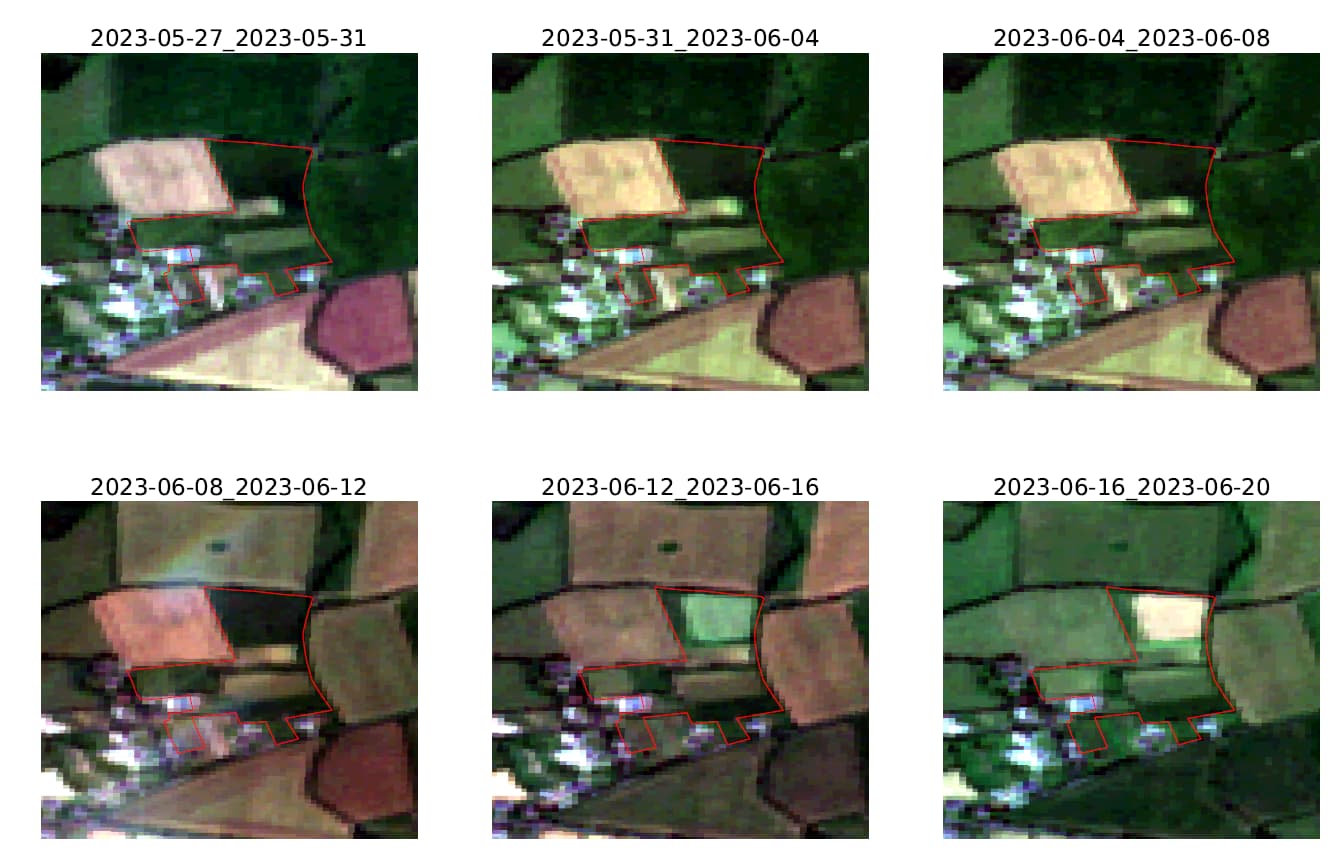
To encourage greater use of EO data, we have created a simple tool that enables anyone to request a time series map. This will cover your area of interest and feature multiple images (where available) captured on different dates across your specified time range. Examples can be seen below, and the map will be provided in PDF format.
We are already vastly experienced in the processing of such imagery and have conducted vast numbers of quality checks related to agriculture, forestry, and biodiversity activities. However, there is vast potential for such imagery and data to be used beyond these fields.
Examples
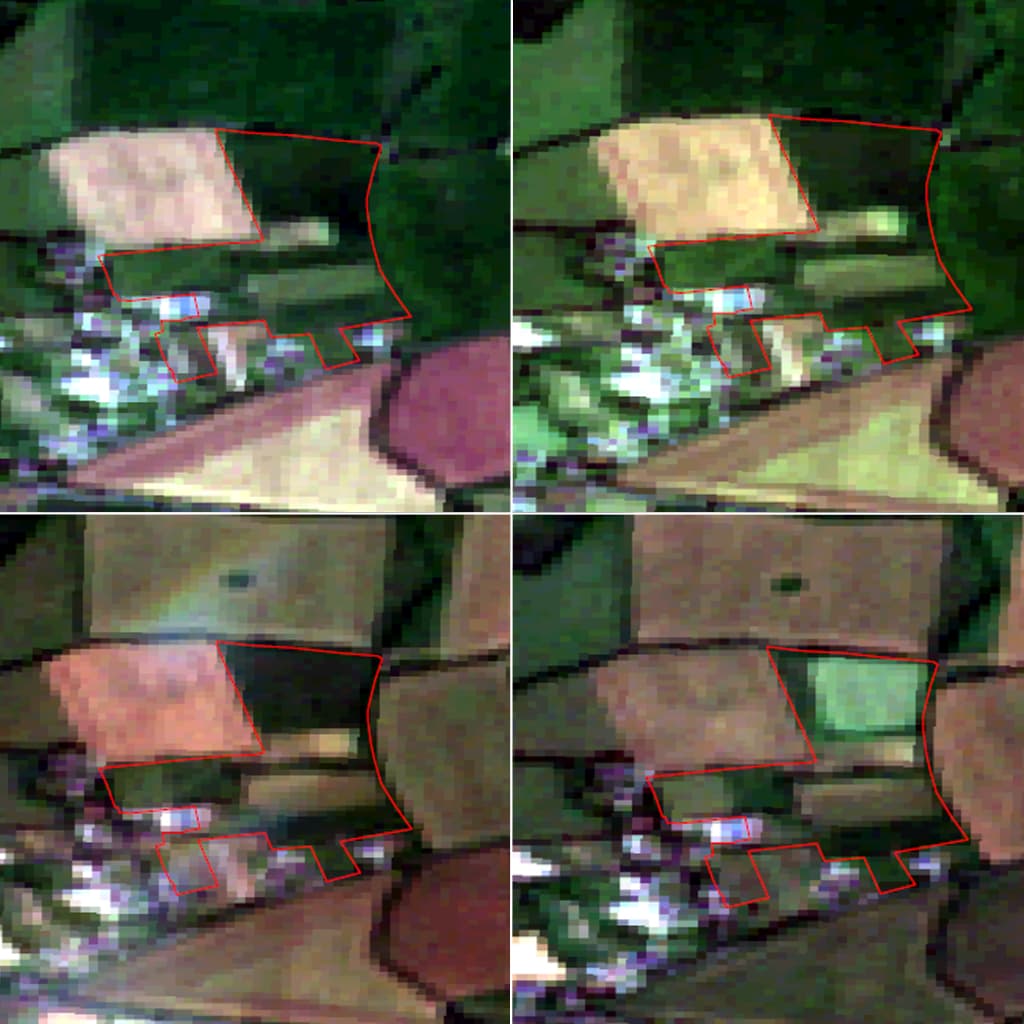
These two sample time series maps show 2 locations captured between 27 May 2023 and 16 June 2023. In the first map, the pace of change on the farmland is clear. The images could be used to monitor natural resources, identify land use changes, or train field staff, among other usages.
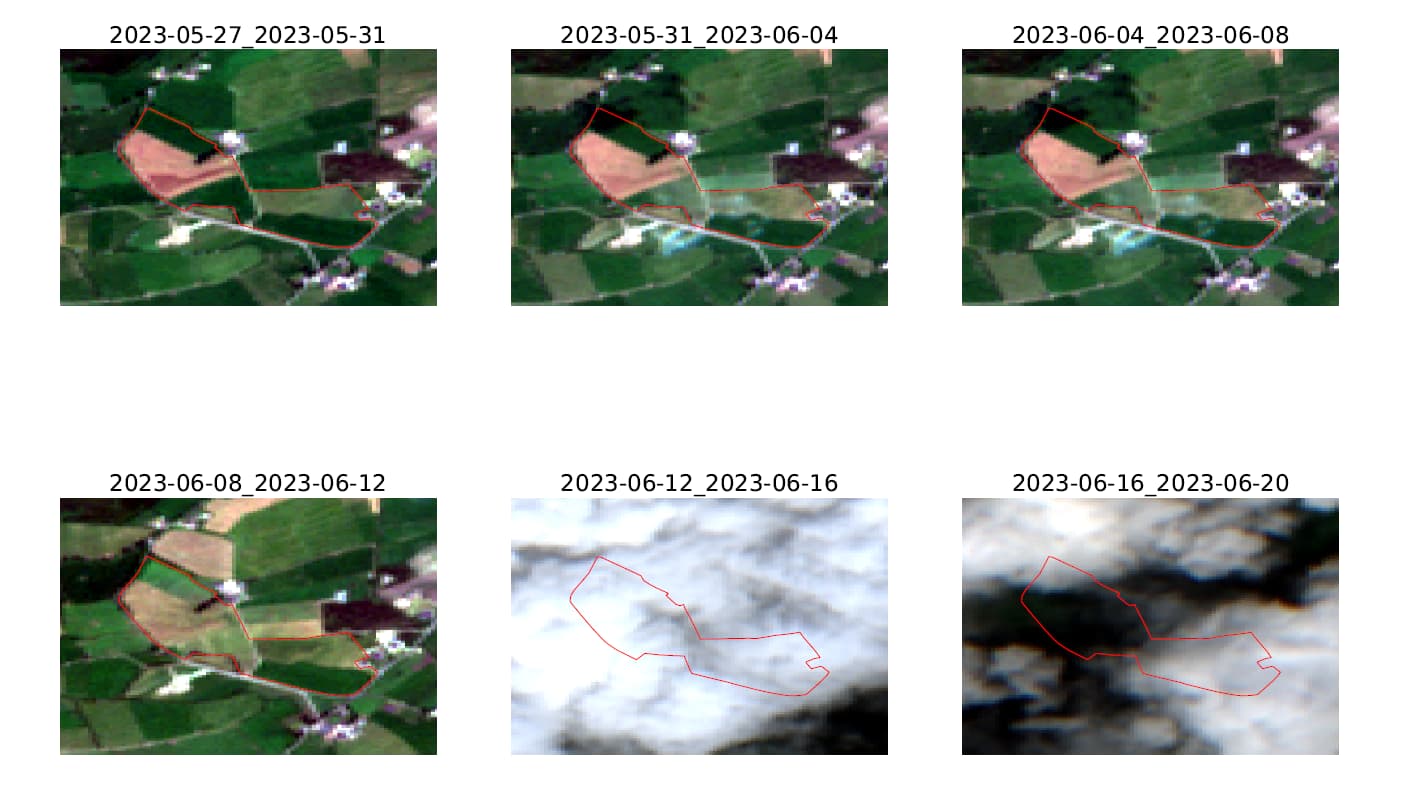
The second map highlights that despite a frequent revisit time, images can be affected by cloud cover. This can vary depending on your area of interest and the time of year.
How to use
To use our tool, head to our contact page here and select ‘Earth Observation Map Request’ from the drop–down menu. Next, complete the form with your details, and in the enquiry section, enter the area you are interested in capturing and the time period under consideration (whether weeks, months, half a year or more).
Once submitted, a member of our sales team will contact you to discuss the delivery of your map.

New Research highlights business opportunities in the All-island Circular Economy
21st Mar 2024
Read Article