Turn your Data into Information & your Information into Insights

16th Aug 2021
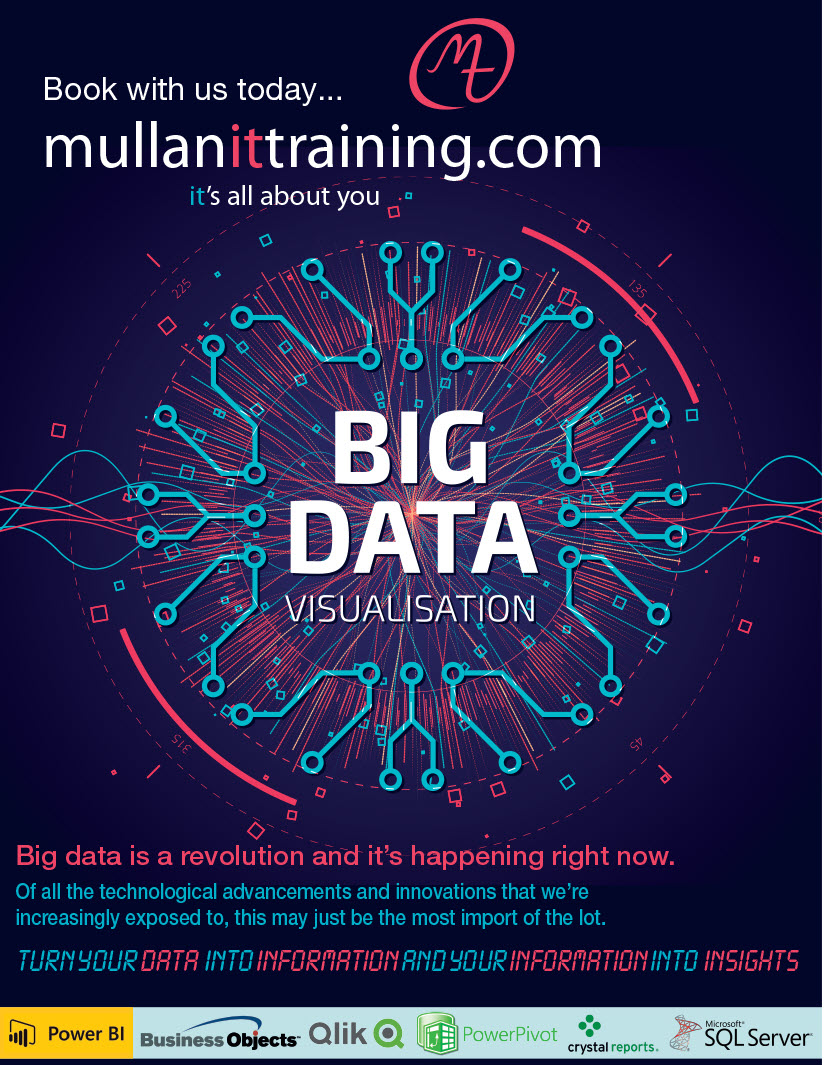
Turn your Data into Information & your Information into Insights…
Data visualisation is the graphical representation of information and data.
By using visual elements like charts, graphs and maps, data visualisation tools provide an accessible way to see and understand trends, outliers and patterns in data.
Visit our websites to find out more about courses we deliver:
Lyons announces Assured Skills Welding Academies at Southern Regional College
16th Aug 2021
Read Article