Other
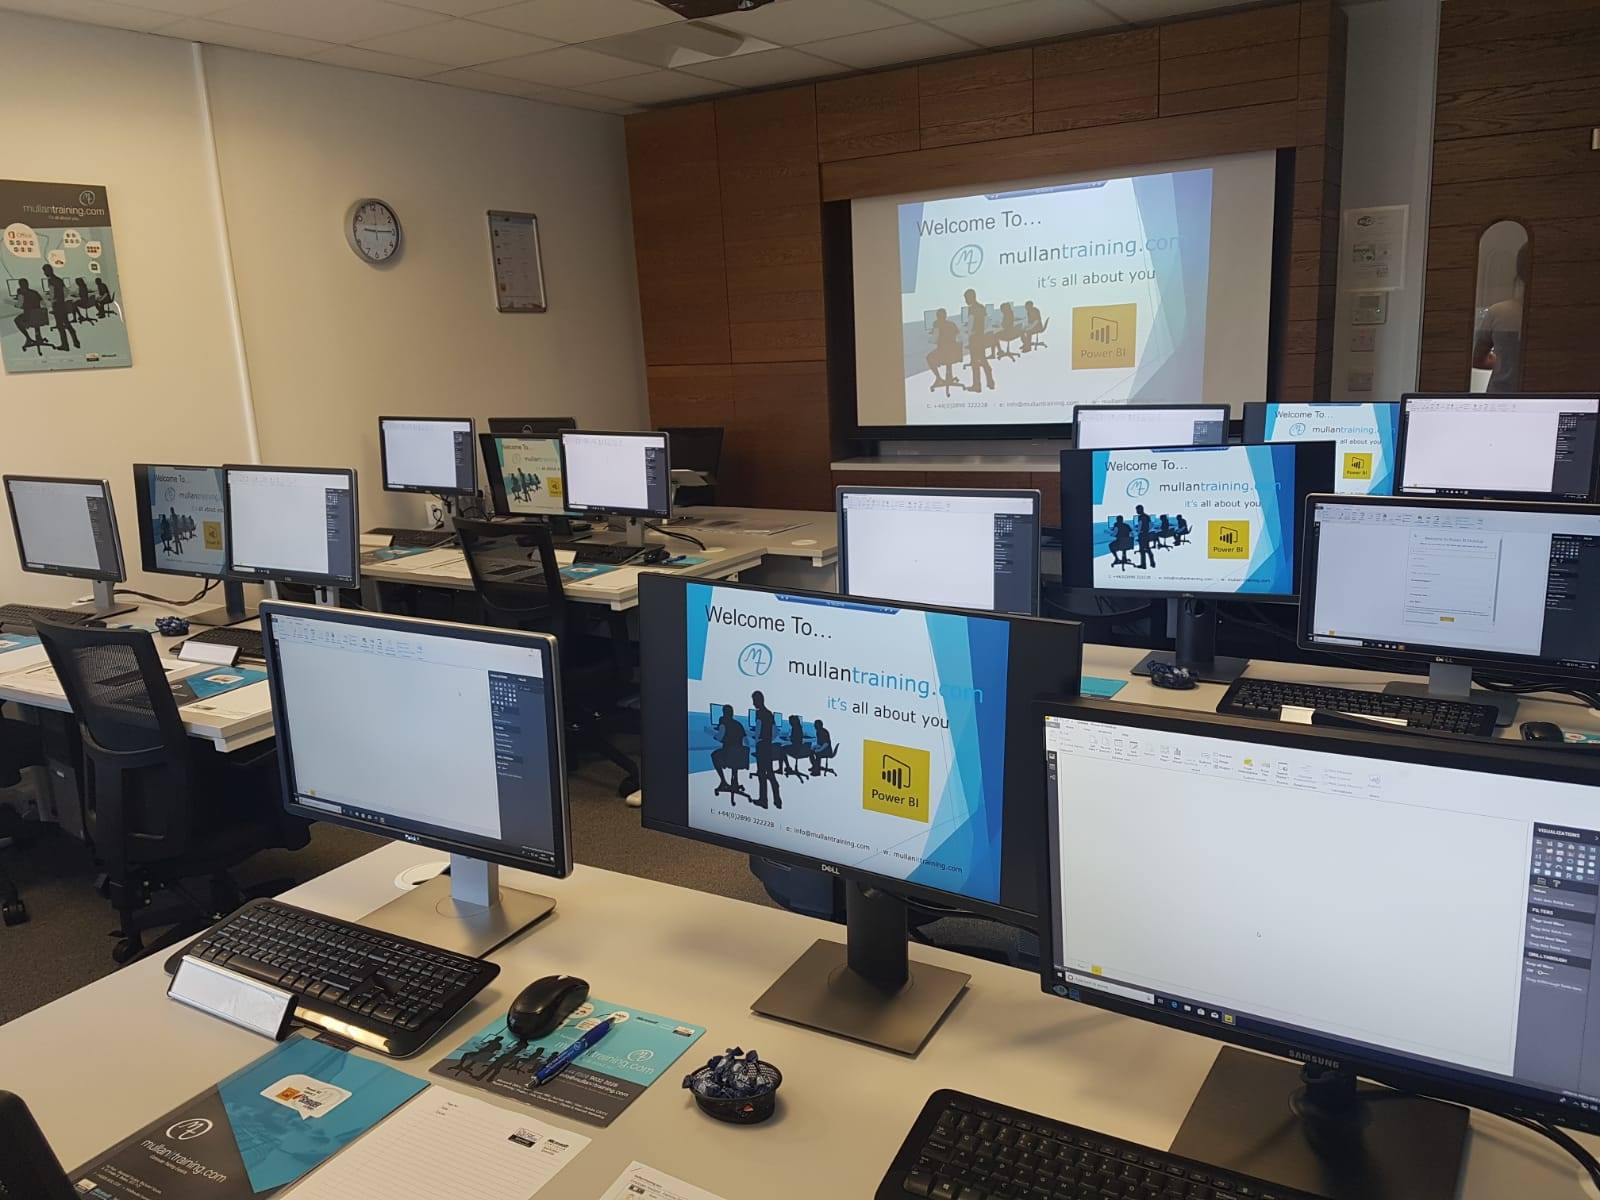
Power BI Level 1 course at our Belfast City Centre Training Suites
14th Dec 2022 09:30 am - 04:30 pm
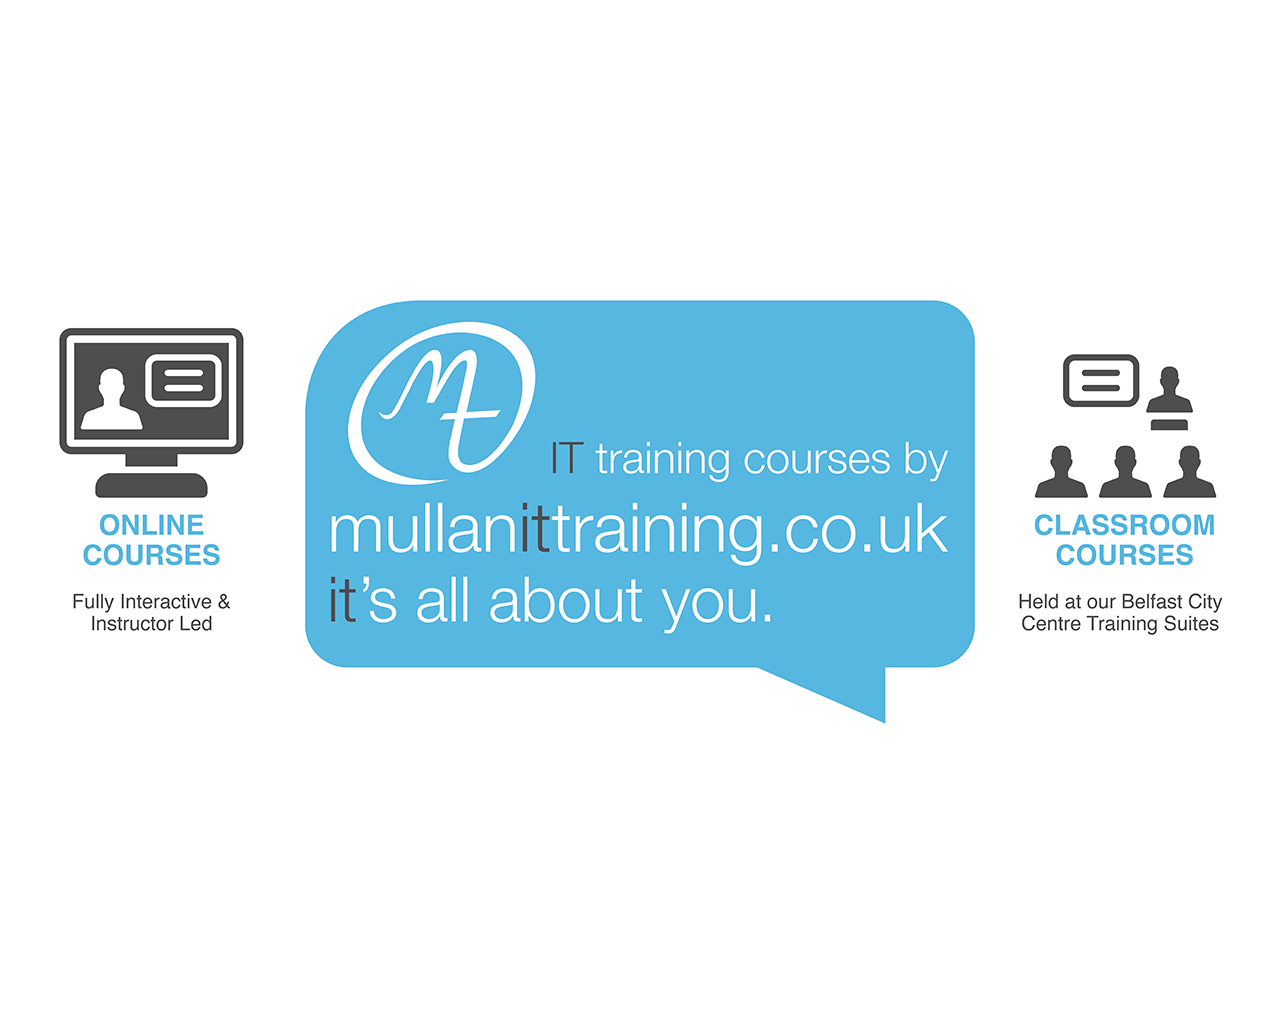
Venue: https://mullanittraining.co.uk/our-city-centre-location
Paid
11th Nov 2022
Event Description
Power BI Level 1:
• Learn how Power BI works & understand what it can do for you
• Get to grips with the main views
• Connect to data sources: Excel, CSV, SQL
• Create attractive & interactive dashboards that users can sort, filter & drill down
• Add visualisations: Bar/ Column charts, Pie charts, Line charts, Combi charts, Slicers, Cards, KPIs, Tables, Maps, Text
• Create calculated columns to enhance the datasets
• Introduce Top/ Bottom N
• See Course Outlines for detailed content:
We deliver Levels 1-4 of Power BI:
– Visualise Your Data
– Connect to Multiple Data Sources
– Clean, Transform & Consolidate Data
– Advanced Functions
T: +44(0)2890322228
E: info@mullanittraining.co.uk